Market Structure
Annualised is not annual
A high annualised rate can describe a short episode. Put APR, APY and holding-period return on the same time basis before comparing them.
An annualised rate expresses a pace of earning in yearly units. It does not establish that the pace will last for a year.
That distinction becomes important when a dashboard highlights a short-lived lending rate, funding payment or incentive programme. The arithmetic can be correct while the interpretation is wrong.
Start with the holding period
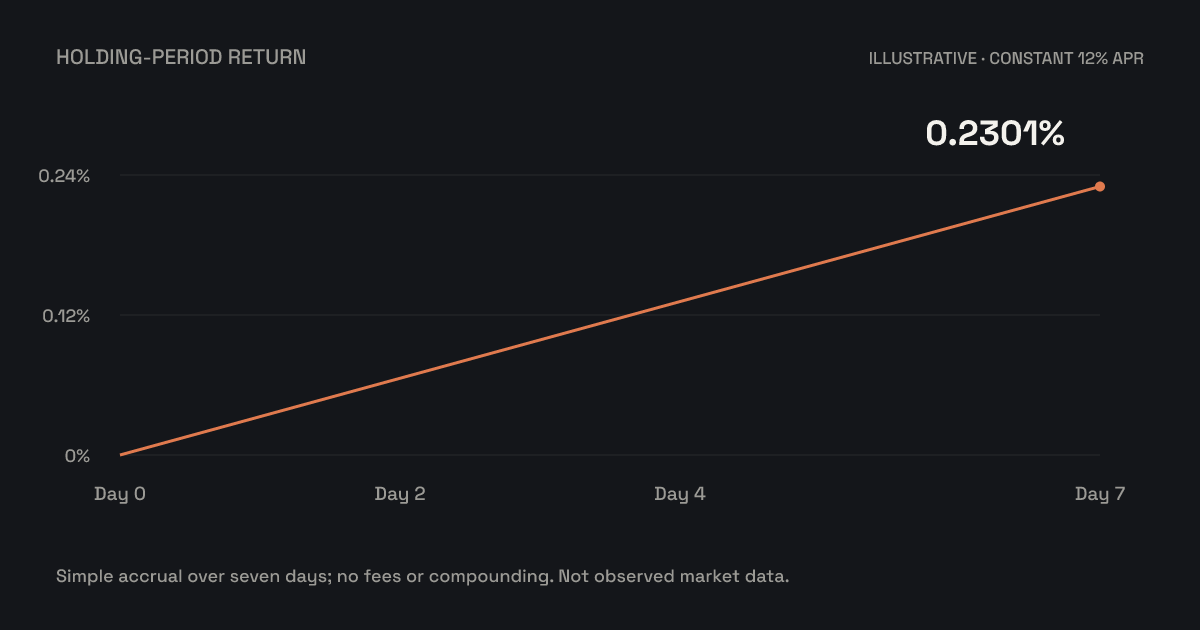
Assume a hypothetical position of 100,000 units earns at a constant 12% APR for seven days. With simple accrual and a 365-day year, interest is:
100,000 × 12% × 7 / 365 = 230.14 units
The return over seven days is approximately 0.2301%. It is not 12%.
Now suppose the rate is 12% APR for those seven days and 3% APR for the next 23 days. Ignoring compounding, fees and balance changes, the 30-day interest is approximately 419.18 units: 230.14 from the first interval and 189.04 from the second.
These are arithmetic scenarios. They are not historical rates, product quotes or forecasts.
Compounding changes the assumption
APR and APY are different ways to express a rate. For a nominal 12% APR compounded monthly at an unchanged rate, the conventional calculation gives:
APY = (1 + 0.12 / 12)^12 − 1 ≈ 12.68%
That number depends on the compounding convention. A product may use a different calculation, and a variable rate may not remain constant. Rewards paid in a different token may require a separate sale or reinvestment step, with its own costs and price exposure.
The existence of an APY figure therefore does not establish that reinvestment is costless, automatic or available at the quoted rate.
Align the measurements
| Figure | What must be specified? |
|---|---|
| Current APR | The current calculation, eligible balance and components included |
| Displayed APY | The compounding convention and reinvestment assumptions |
| Historical average rate | Observation window, sampling and weighting |
| Realised return | Actual cash flows, costs, holding period and valuation basis |
An average of displayed annual rates is not necessarily the return earned by a position. Balances can change, observations can miss short episodes, and incentives can be paid in an asset whose value changes.
A useful return calculation tracks the position through time. For simple interest, apply each rate to the balance and duration for which it actually applies. For compounded returns, use the relevant balance updates and reinvestment mechanics rather than extrapolating a single displayed figure.
Rate comparisons become meaningful after the time basis is aligned. The first question is not which annual number is larger, but which cash flows the intended position could receive over its actual life.